Shushilan Central Monitoring Index
Real-time tracking, comprehensive analytics, and automated reporting for your projects. Make data-driven decisions with our powerful monitoring dashboard.
24/7
Real-time Monitoring

Real-time tracking, comprehensive analytics, and automated reporting for your projects. Make data-driven decisions with our powerful monitoring dashboard.
Enter your credentials to access the dashboard
Our platform provides all the tools you need for effective project monitoring and evaluation
Monitor project performance with live dashboards that update as data comes in, ensuring you always have the latest information.
Receive instant notifications when projects deviate from targets, budgets, or timelines, allowing for quick intervention.
Define and track custom Key Performance Indicators tailored to your project's specific requirements.
Visualize project locations and progress on interactive maps with our integrated geospatial tools.
Generate compliance reports, progress updates, and executive summaries with a single click.
Provide customized dashboards to different stakeholders with role-based access controls.
Our intuitive dashboard provides all the monitoring tools you need in one place:
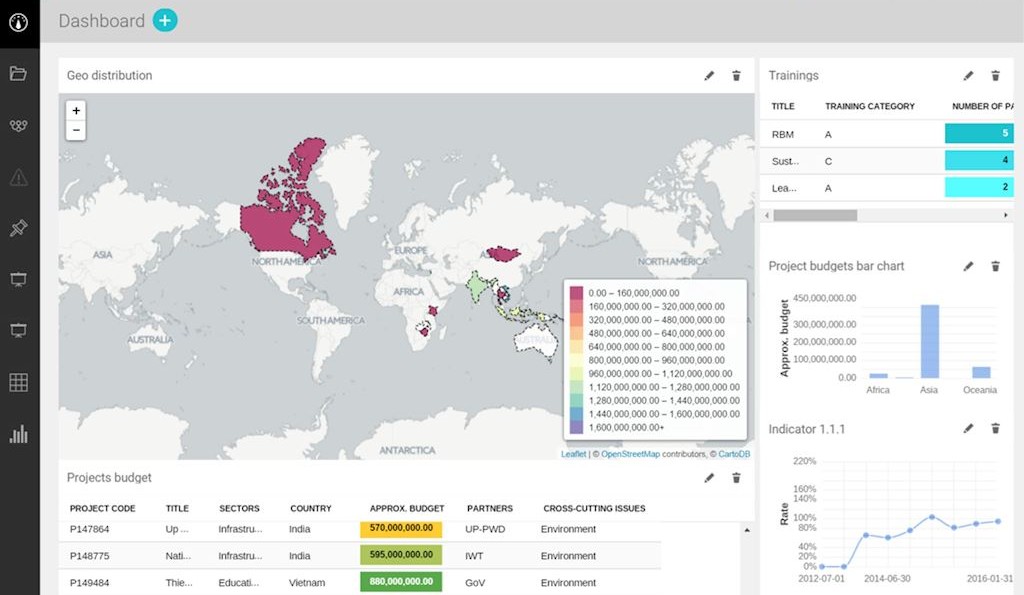
Track every aspect of your projects with our comprehensive monitoring tools
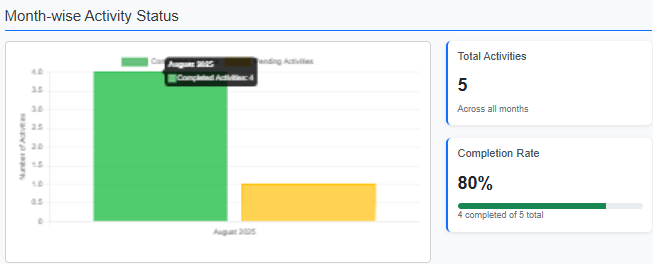
Monitor project milestones and deadlines with automated progress calculations.
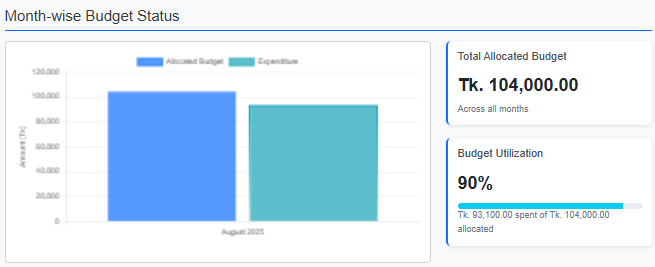
Track expenditures against budgets with visual indicators for overspending.
Identify and monitor potential risks with our risk assessment matrix.
Evaluate team productivity and resource allocation across projects.
Transform your project data into actionable insights with our visualization tools
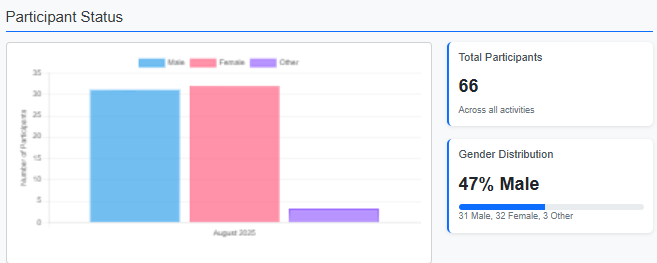
Create and customize charts that allow drilling down into specific data points.
Visualize project locations and regional performance on interactive maps.
Track project timelines and dependencies with dynamic Gantt charts.